Land Rover Series I
1948–1958
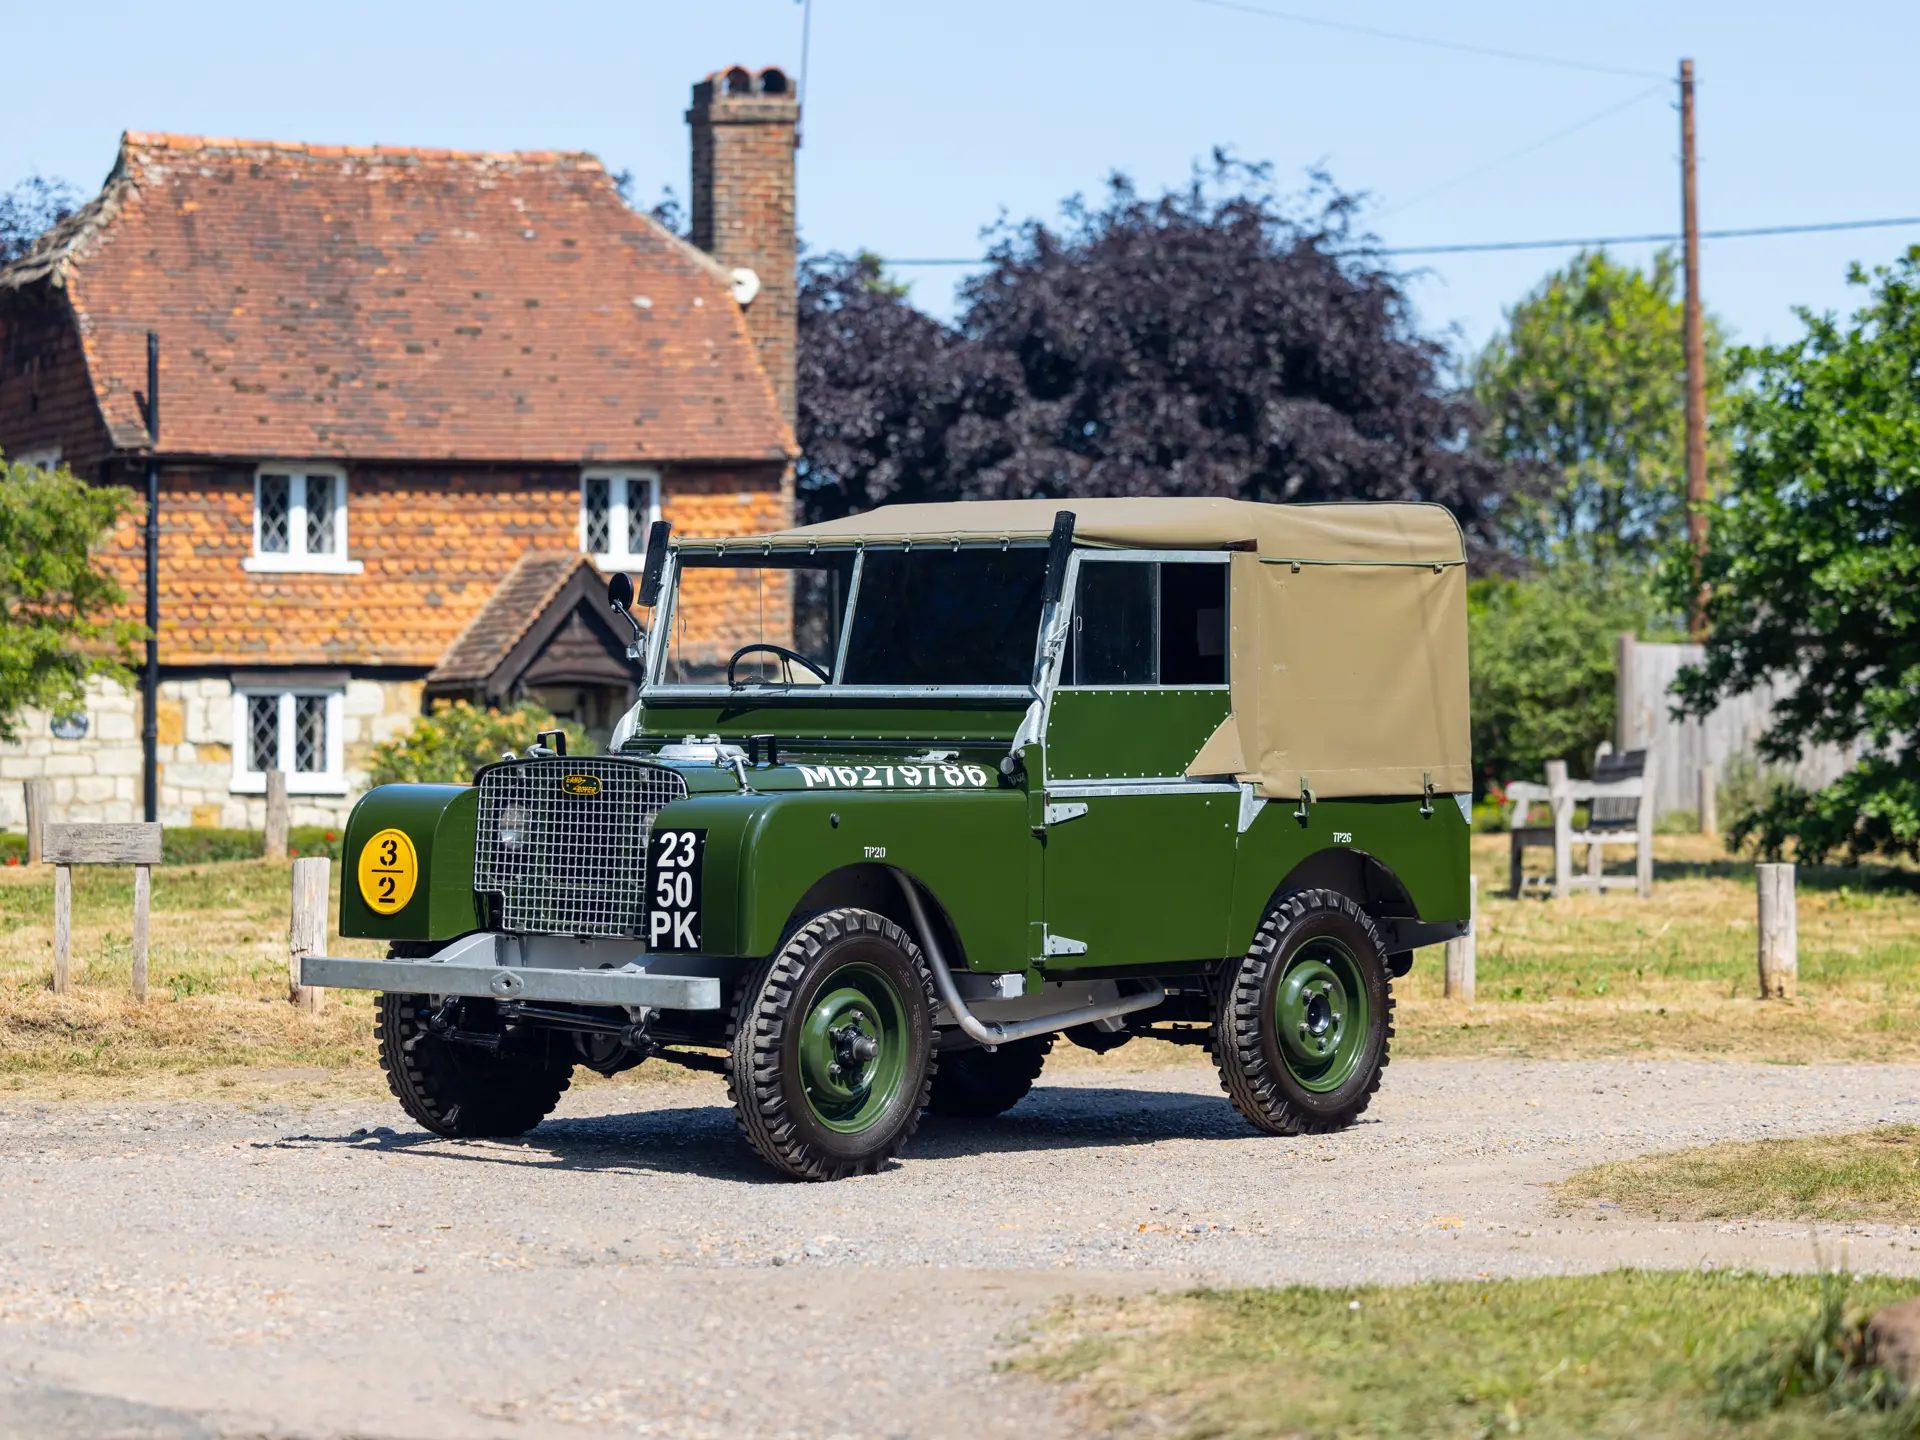
Based on 19 verified auction results
—
Market value · recent verified sales
Price History
MSRP
—
Collectibility
6/10
Collectible
3-Year Forecast
£0
+10%
5-Year Forecast
£0
+13%
Market scores
30
Desirability
Illiquid
10
Liquidity
Moderate
50
Resale Outlook
Spec Premium Engine
How spec moves the priceBuilt ≤ 1954
£21,750 median (n=11) vs £60,000,007,500 (n=8)
-100%
Computed from this model's verified auction sales. Premiums are the % difference between the median price of matching-spec lots vs the rest. Requires at least 3 sales on each side to be shown.
Marque analyst note
The Series I market remains opaque on current pricing, with no recent transactions tracked over the past twelve months limiting our ability to establish a reliable median value or directional signal. The total pool of nineteen recorded sales across all tracked time periods suggests sporadic activity that makes real-time pricing difficult to pin down.
Liquidity in this segment is constrained, with no active listings currently available and minimal transaction volume. For buyers or sellers, this illiquidity means extended holding periods and wider bid-ask spreads should be expected when deals do occur.
The Series I carries a collectibility score of 6 and sits in the appreciating classic tier, positioning it as a legitimate collector asset despite the low desirability reading in the current market. Production figures remain unknown in our dataset, though the model's historical significance and relative scarcity continue to underpin its classic status.
The long-term outlook shows modest but consistent appreciation potential, with base-case projections suggesting 9.5 percent growth over three years and 12.8 percent over five years. These gains reflect the gradual strengthening of early Land Rover values rather than any near-term acceleration in demand.
Depreciation Benchmark
- Segment average+3.0 to +9.5%/yr
Best time to buy
Monthly price index vs. this model's averageBest deals on this model historically land in Oct (~48% below average). Avoid Jan, when competition drives prices higher.
Est. Annual Ownership Costs
- Insurance (agreed value)£450
- Maintenance£900
- Storage£2,400
- Depreciation— (appreciating)
- Total annual cost£3,750
Analyze a listing
Found one for sale? Get an instant verdict.
Enter the ask price (and mileage, if you have it) for an instant read against verified market data.
Not enough verified sales for this model yet to score a listing.
Market Liquidity
- Active Listings0
- Sales Last 12 Months7
- Sell-Through37%
Market Snapshot
- Active Listings0
- Avg Sale Price£21,614
- Avg Mileage at Sale—
- Recent Price Range£4,830 – £65,582
- Total Sales Tracked19
Recent sales
Showing latest 19£4,830
bonhams · 19 Apr 2026
£48,300
bonhams · 19 Apr 2026
£19,550
bonhams · 19 Apr 2026
£31,050
bonhams · 19 Apr 2026
£11,500
bonhams · 19 Apr 2026
£23,000
bonhams · 19 Apr 2026
£17,000
Collecting Cars · 5 Aug 2025
£15,250
Collecting Cars · 8 May 2025
£26,829
the-market · 29 Apr 2025
£16,000
Collecting Cars · 10 Apr 2025
Indicative only — not investment advice. Past performance is not a reliable indicator of future value.